Don’t just read your tests. Watch them.
Turn every test run into a clear story. Follow calls, timings, and outcomes without trawling logs.
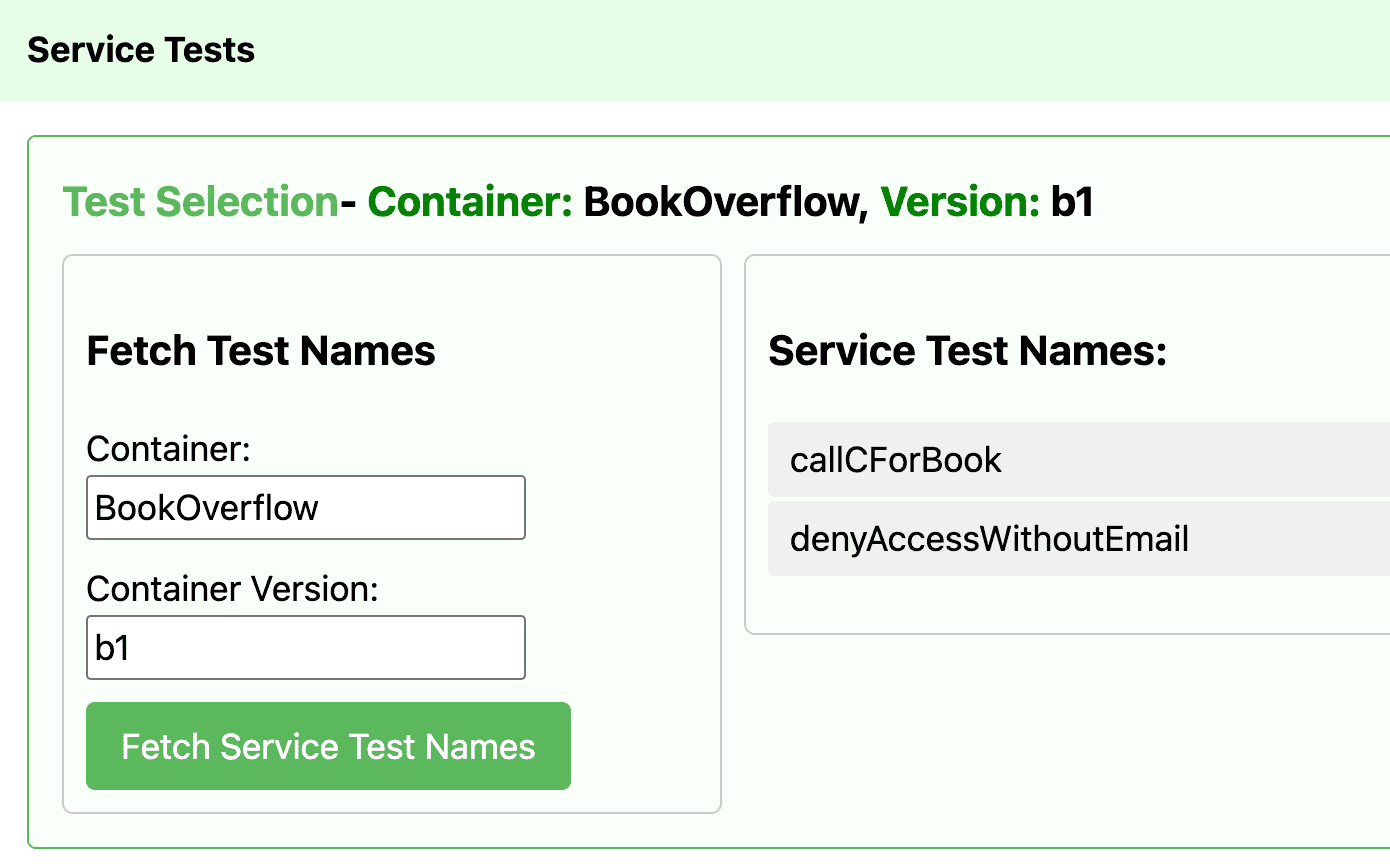
Choose your test
See and choose from every test that was present in the version you selected.
See what actually happened
Trace every interaction a test performed, with timing and metadata.
Drill down to payloads and headers, or zoom out for the big picture.
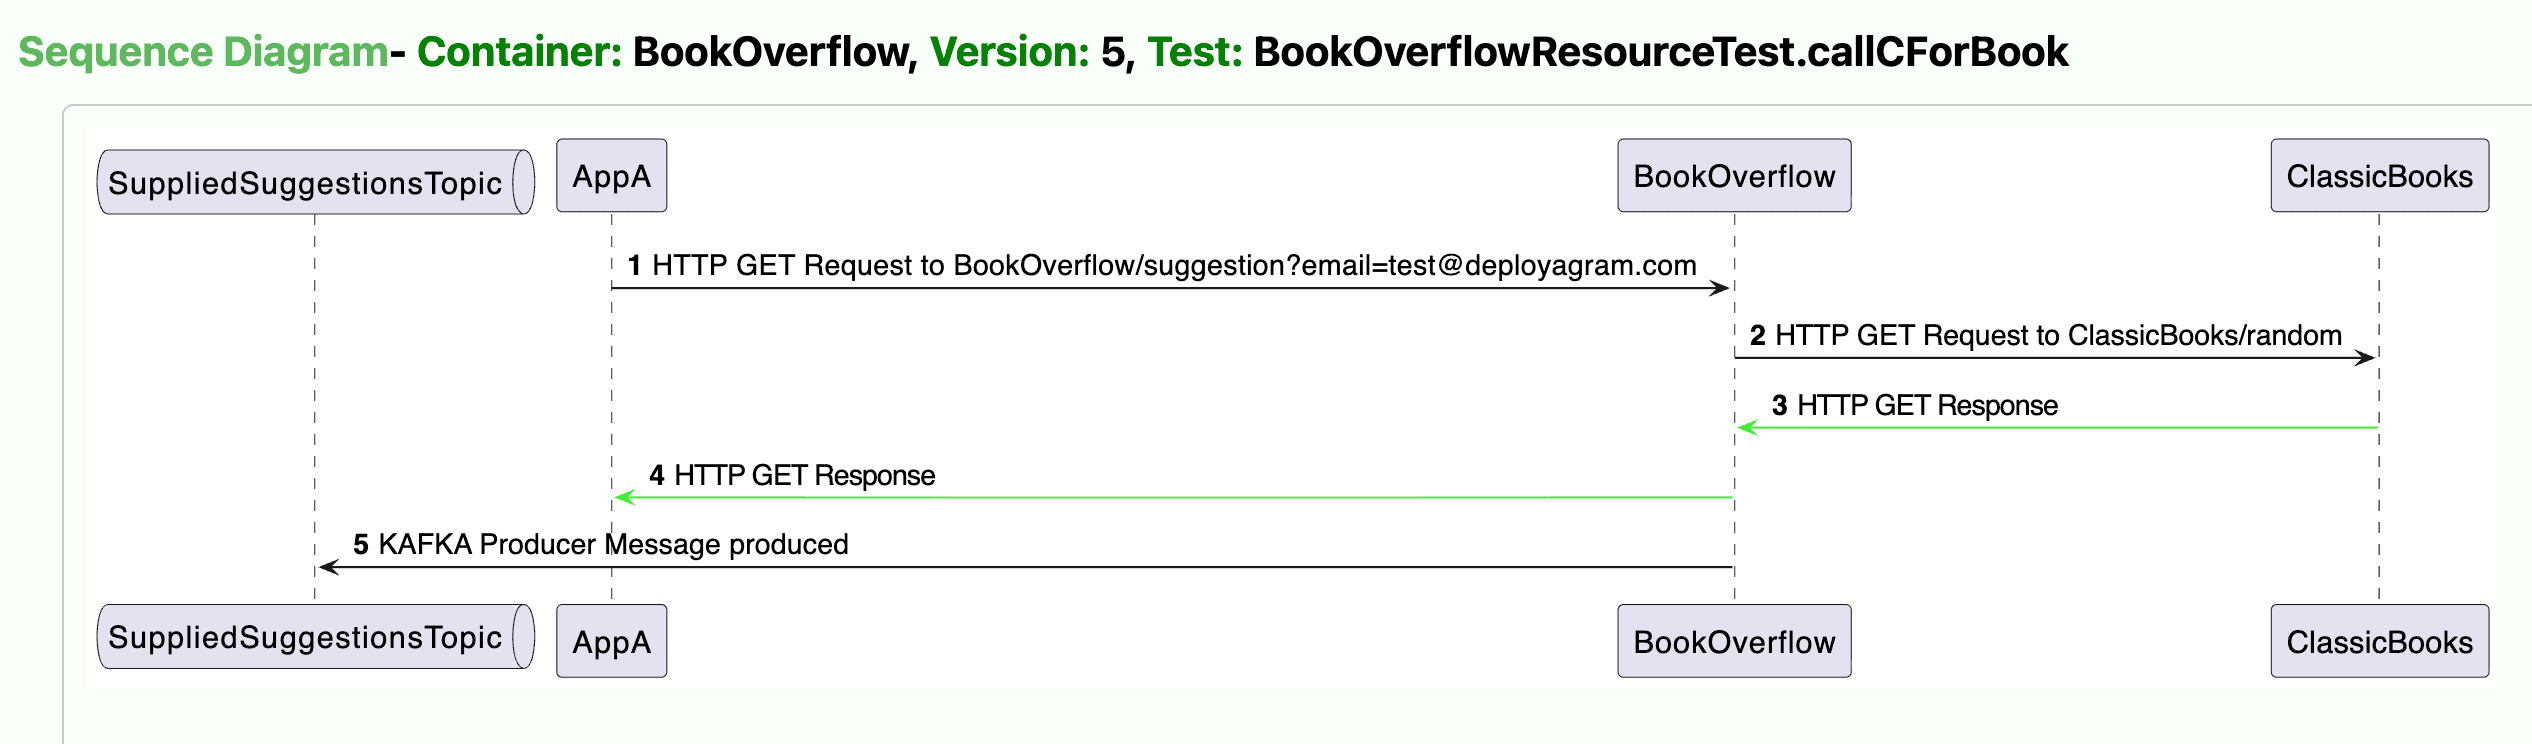
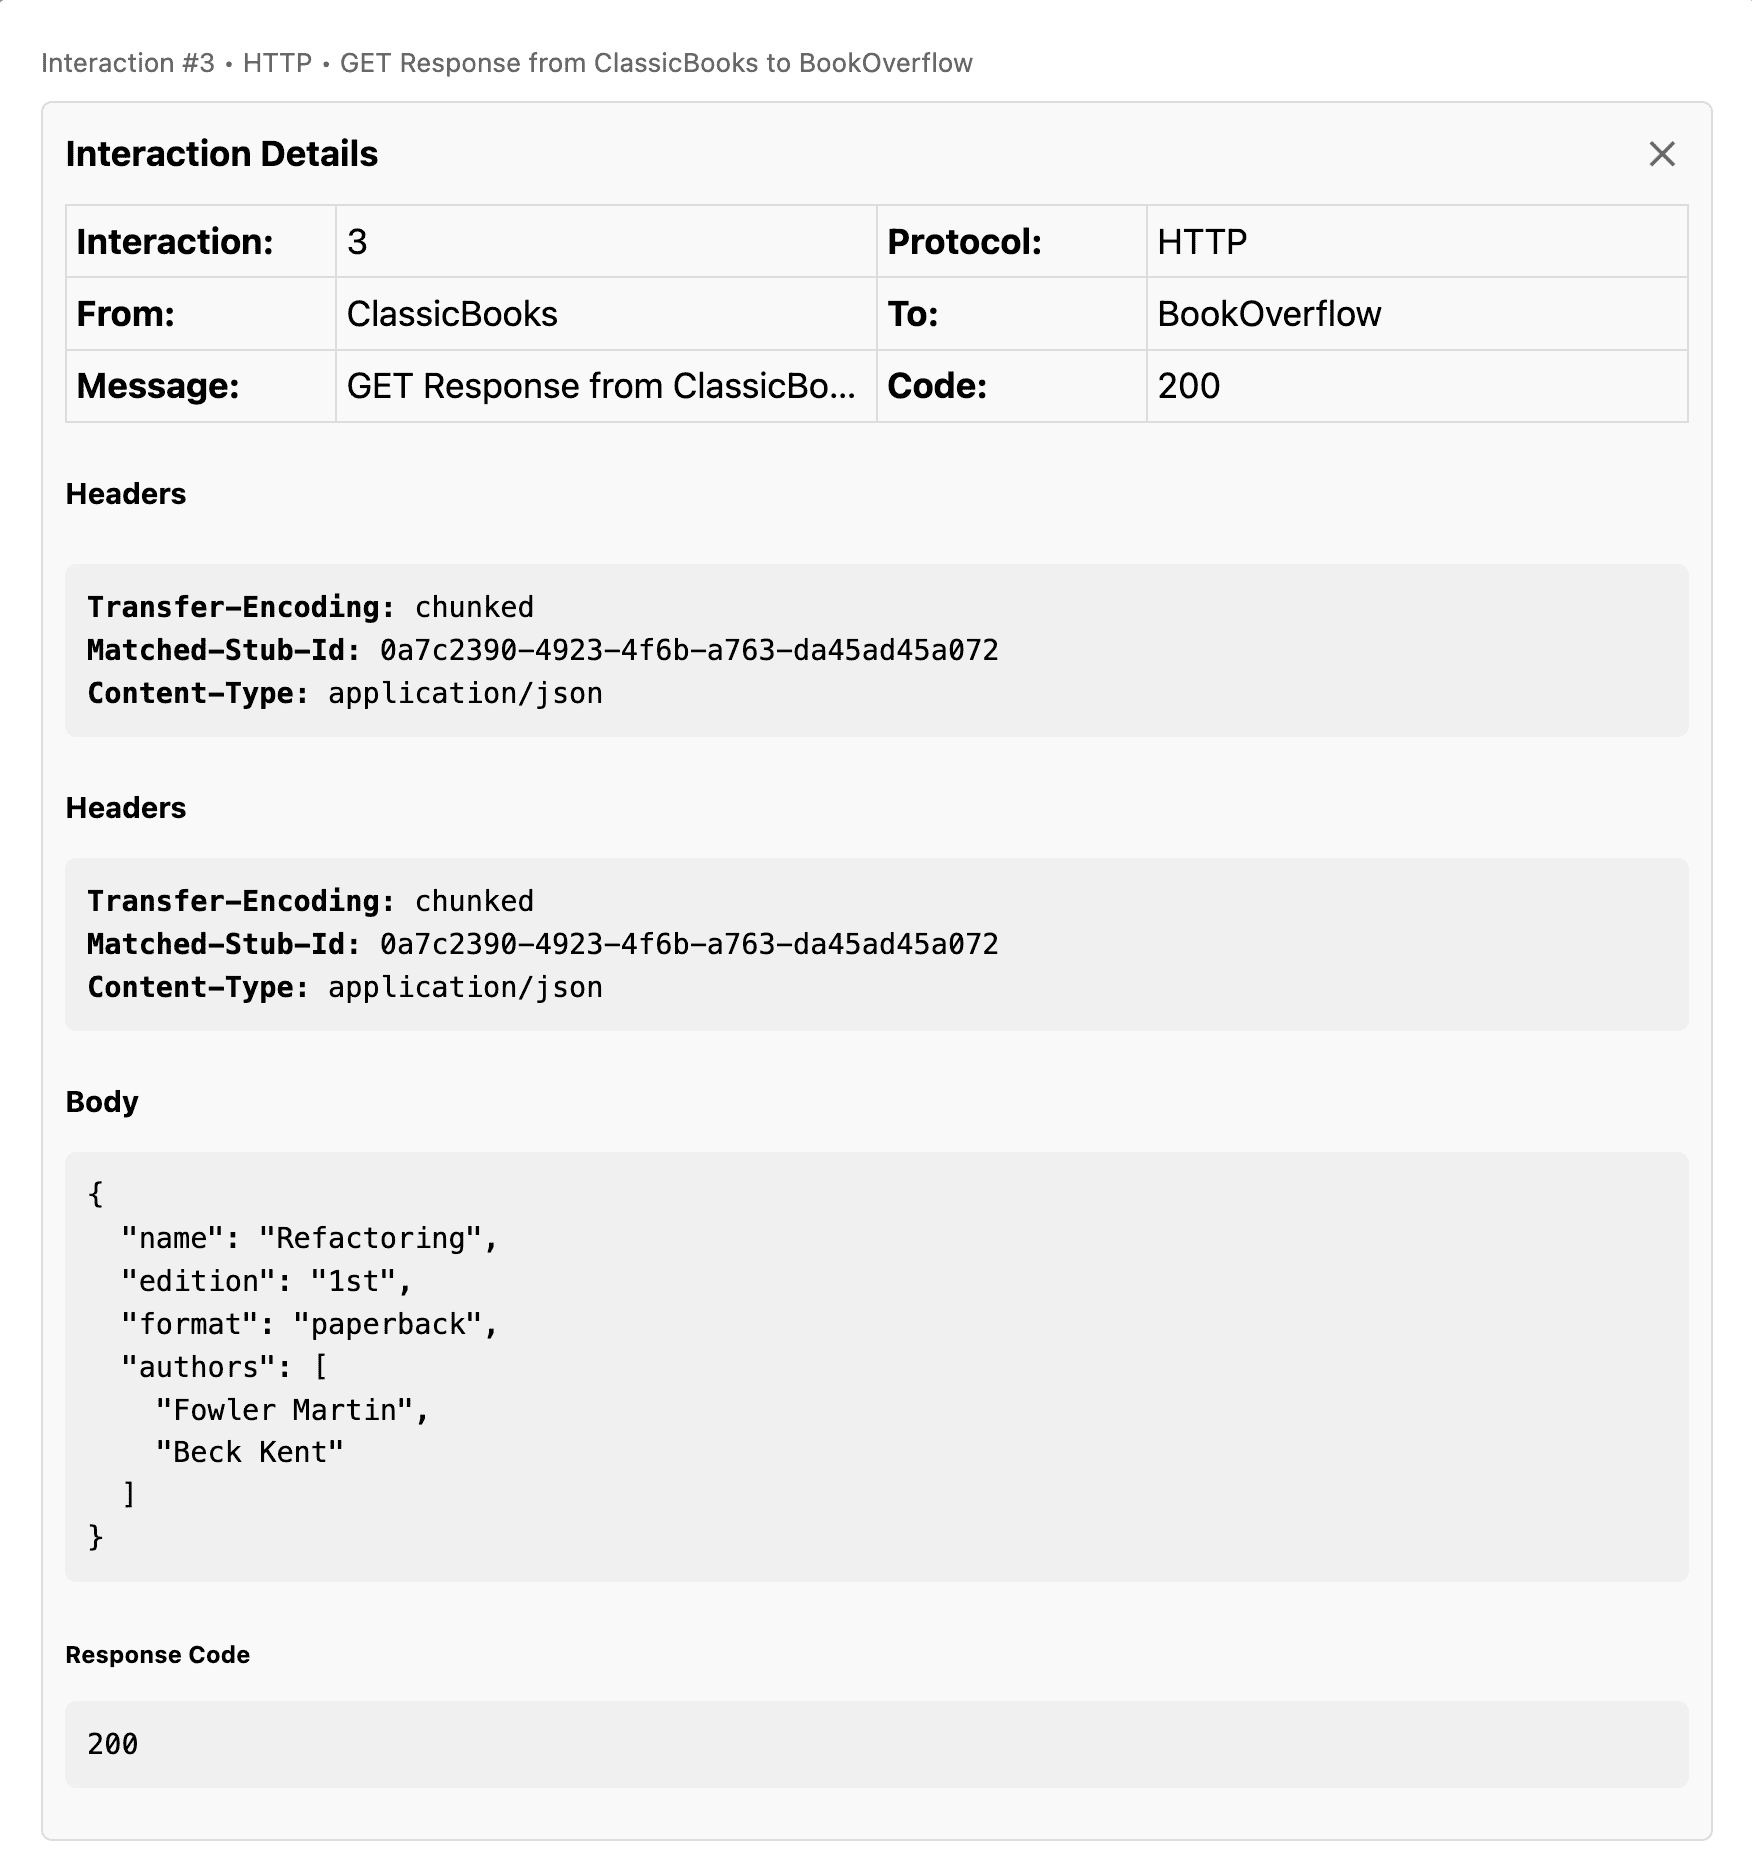
Click any line to inspect the content.
Explore requests and responses directly from the diagram — click on any interaction line to open the full details, including payloads, headers, status codes, and timing.
No more hunting through logs: the data is a tap away.
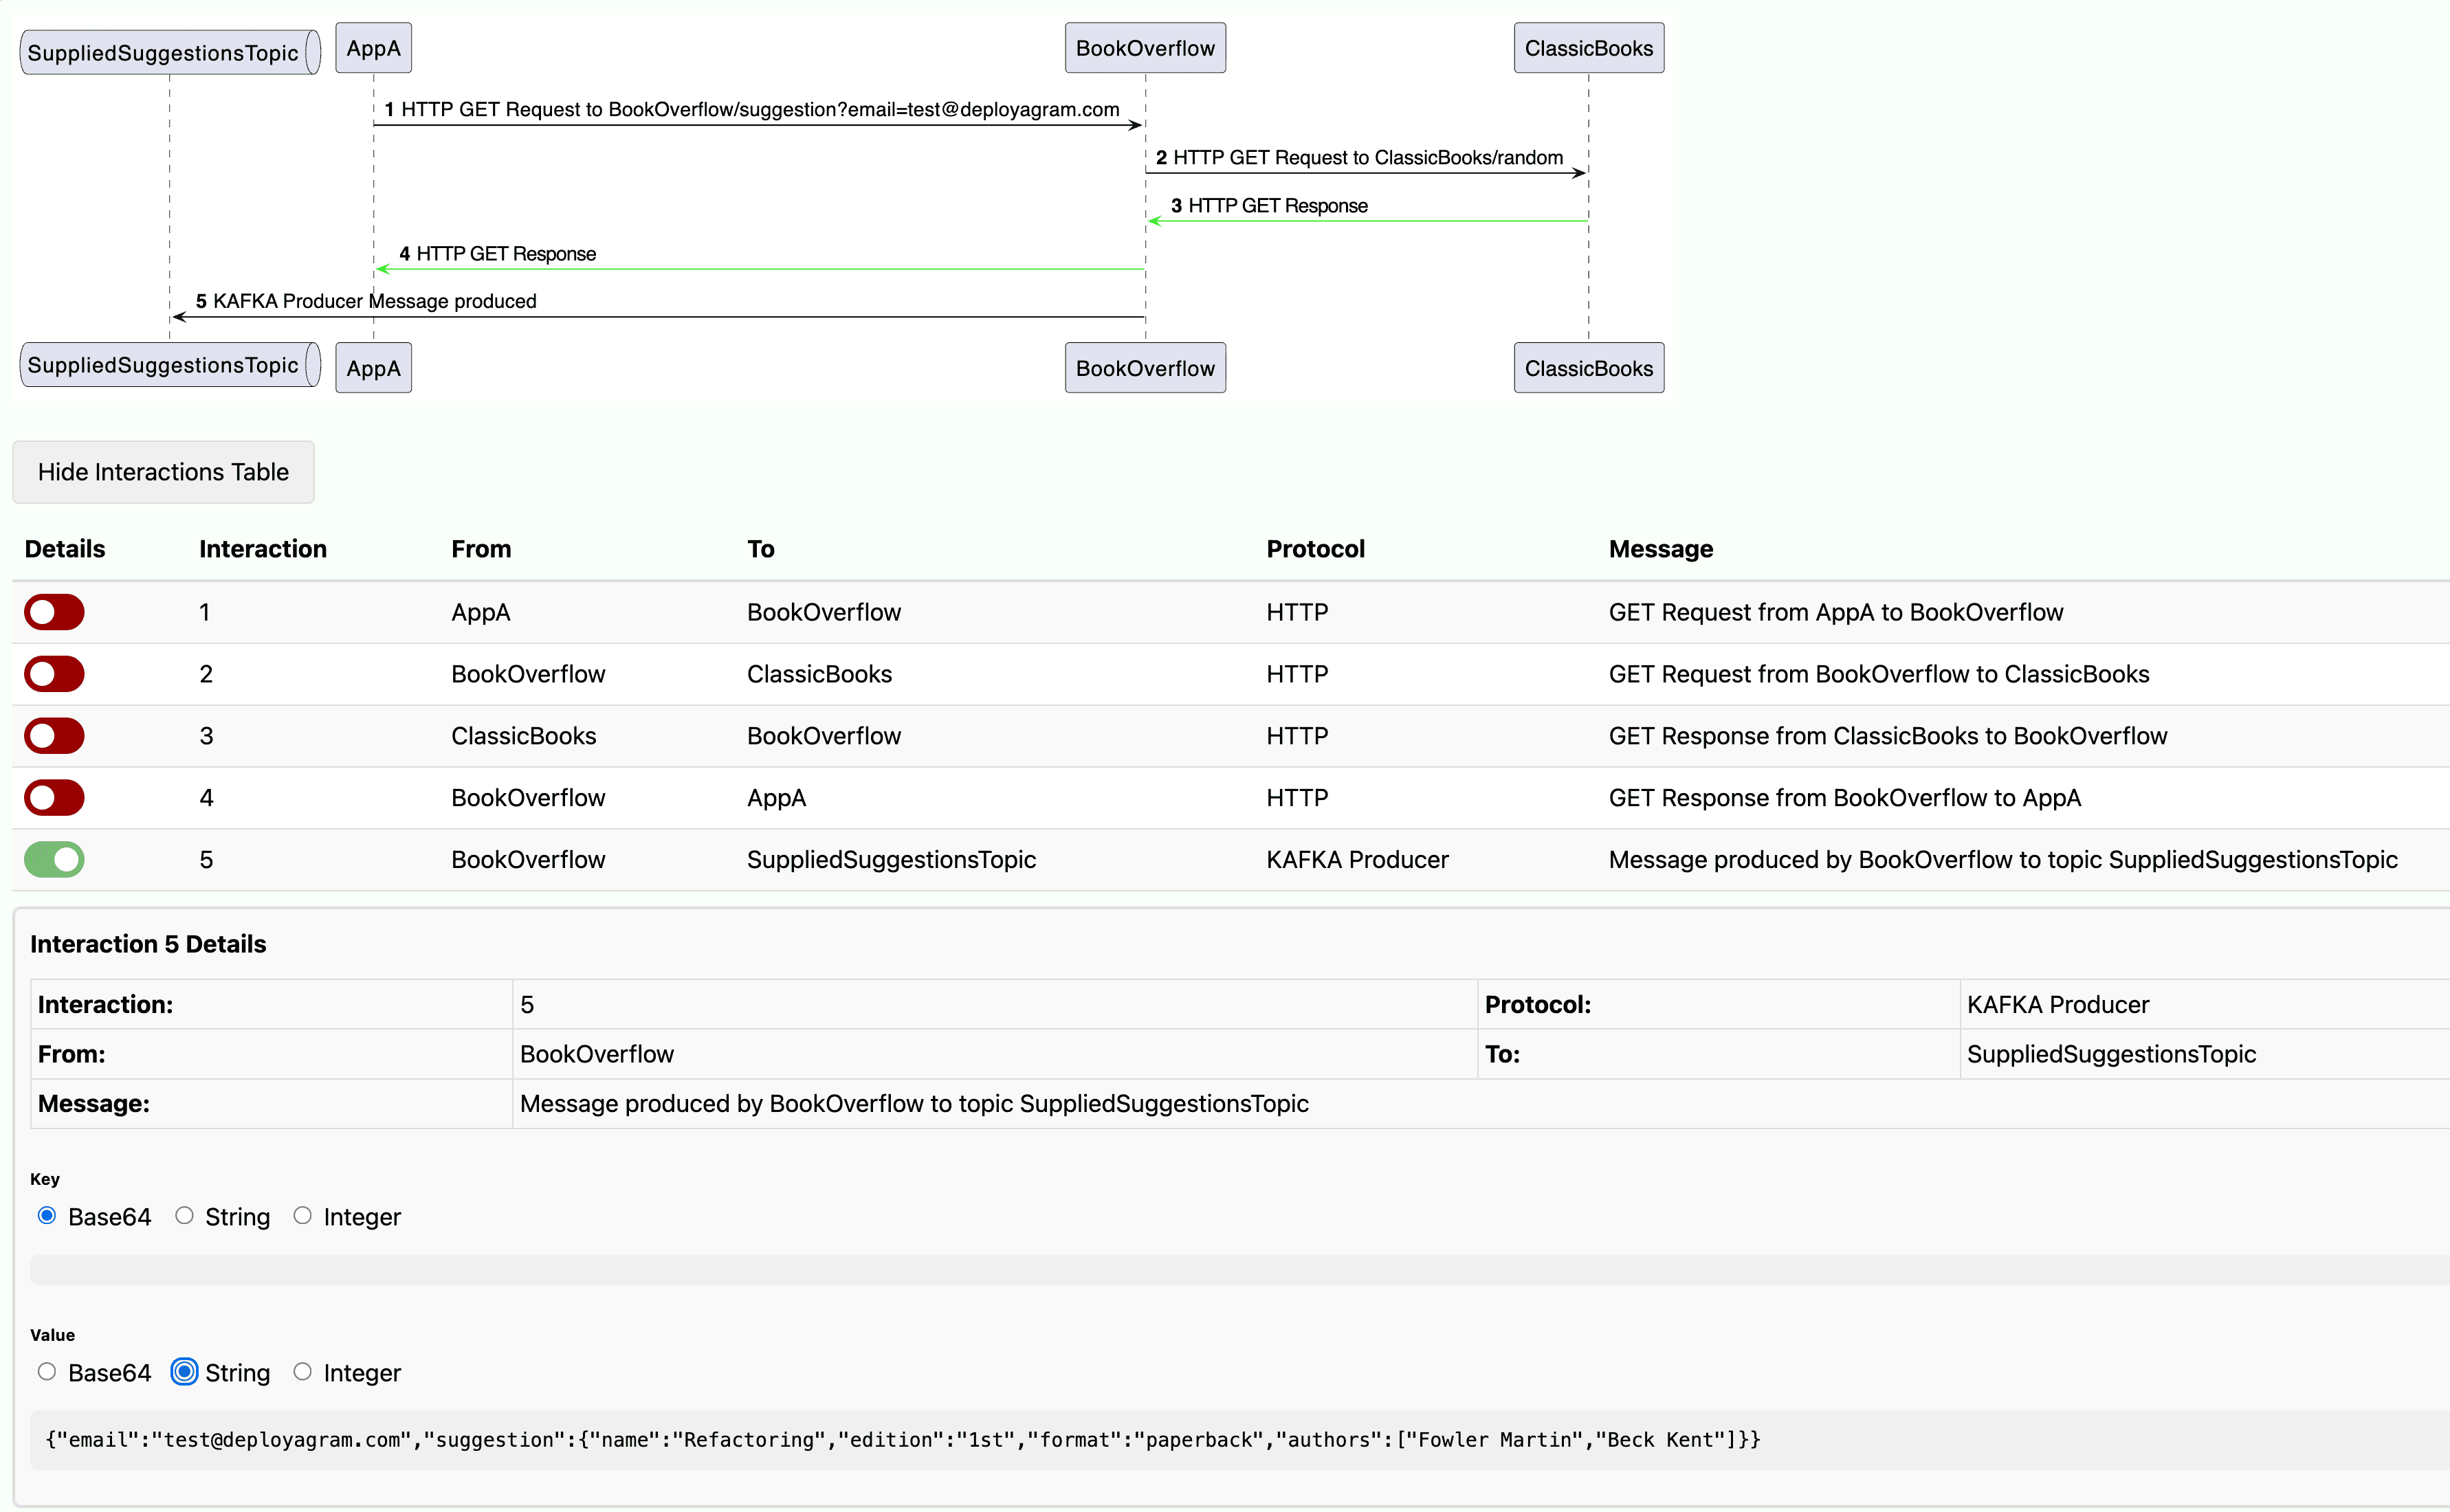
View every interaction in a table.
Switch to the table view to see all interactions from a test run in one place — sortable and filterable by service, endpoint, status, and time.
Quickly scan and search the data you need.